
We often post data online showing the results of a Doppler analysis. The concepts can be a bit intimidating to understand but with a little explanation it’s accessible to anyone.
Read more: Understand Doppler AnalysisWhat is the Doppler Effect?
When something emits electromagnetic radiation and is moving relative to an observer the observed wavelength of the emitting radiation will be different. Essentially when things are moving their movement effects how the waves of radiation arrive at the observer. If they are moving toward each other the wave crests successively arrive earlier thereby decreasing the wavelength observed. If the objects where moving apart then the opposite happens and the wavelength increases.
So how does this apply to observing satellites? Imagine you are at a very large train station that has an infinite number of tracks coming and going from the station in all directions. East, West, North, South and even up into the sky and down into the Earth. Further imagine you are listening to the whistles of all these trains passing through the station. Some are moving fast some slow all going in different directions. As almost everyone has experienced the pitch of the whistles note will change based on the change in velocity of the train as it passes you by. If you really pay attention you will notice the pitch of all the trains coming and going is different depending on their orientation to you, their speed and even if you decide to walk around the station and move yourself.
Using this knowledge one could use the Doppler effect to map out the train’s trajectories as they pass and determine which are which especially if they follow schedules and are on predefined routes. This is what we are doing to track satellites with the Doppler effect. Instead of whistles the satellites have radio transmitters. Instead of tracks they have orbits in which they are locked into by the force of gravity. These orbits are periodic and predictable. Therefore, if you know about how your moving and have observed data from the satellite’s radio transmitter you can compare this to a large number of guesses about the orbit it’s in and find matches that best fit the orbit. If you have a list of known satellites in known orbits you can compare that list to the data you collect to find the best match too.
All that is going on is systematically observing the change in frequency of the satellite’s radio emissions and then comparing that to a large number or educated guesses to find the best fitting guess to the data.
Understanding Doppler Analysis Plots
The following provides a brief walk through to orientate a reader on what Cees Bassa’s Satellite Tools Radio Frequency (STRF) displays as a result of a Doppler analysis of a signal. This should provide the reader with enough context to understand the display given our comments earlier.
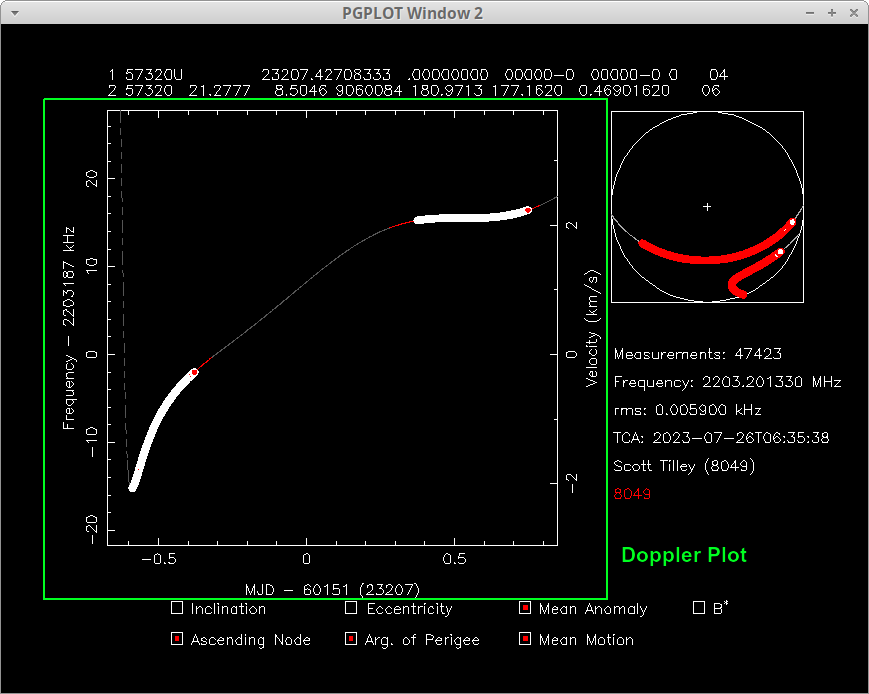
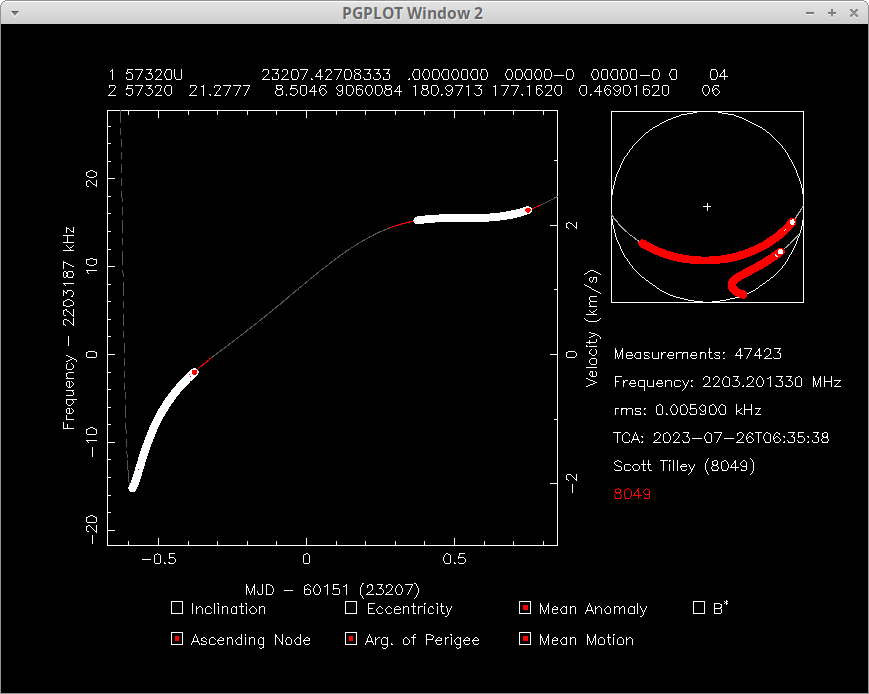
The Doppler plot noted above provides the raw Doppler frequency data (left y-axis) and the resulting range rate (line of sight velocity) on the right y-axis. The x-axis is time in Modified Julian Date (MJD).
Frequency is self evident as it’s the data we collect with our radio and antenna from the satellite. The range rate is a bit more obtuse. Range rate can also be better described as the line of sight velocity between two things. I.e. the resultant velocity at that time of perhaps two things moving with respect to each other. Doppler frequency tells us directly about this line of sight velocity and is what is actually used to compare the orbital models against.
Modified Julian Date (MJD) is a computationally friendly time system that allows for easy consecutive calculation of time based on a defined epoch (start date) of the system. MJD is used a lot in astronomy and astronautics.
Inside the plot the white lines (dots) are selected Doppler data. The grey line is the predicted Doppler curve when the object is below the observer’s horizon. The red line segments are when the object should be above the observer’s horizon.
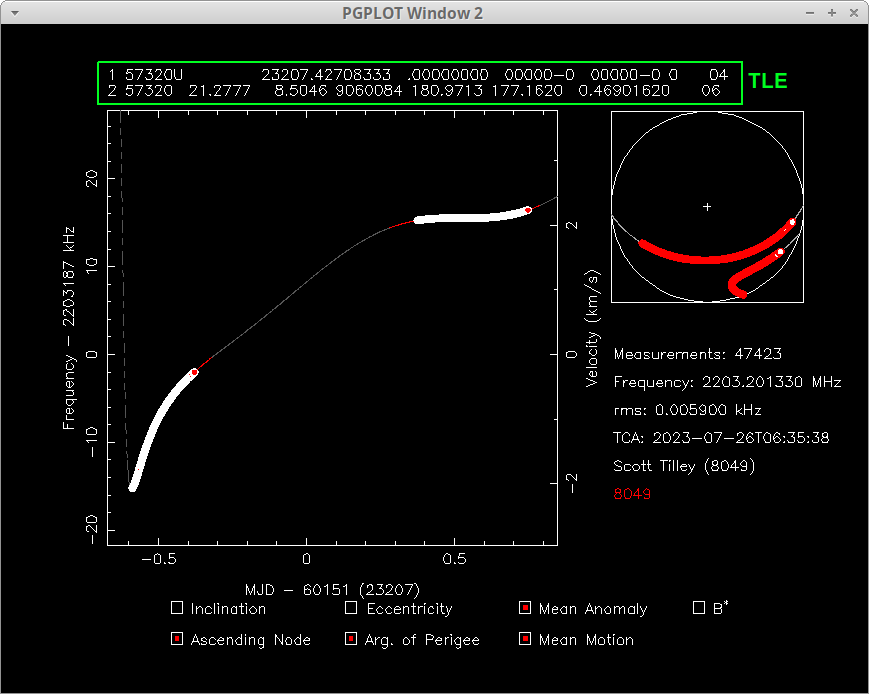
The Two Line Element block displays the current ‘template’ orbital elements being modelled. If you want to learn more see my article on Basic Orbital Dynamics. The user can use template orbits, old orbits to update and also change the settings based on knowledge and intuition.
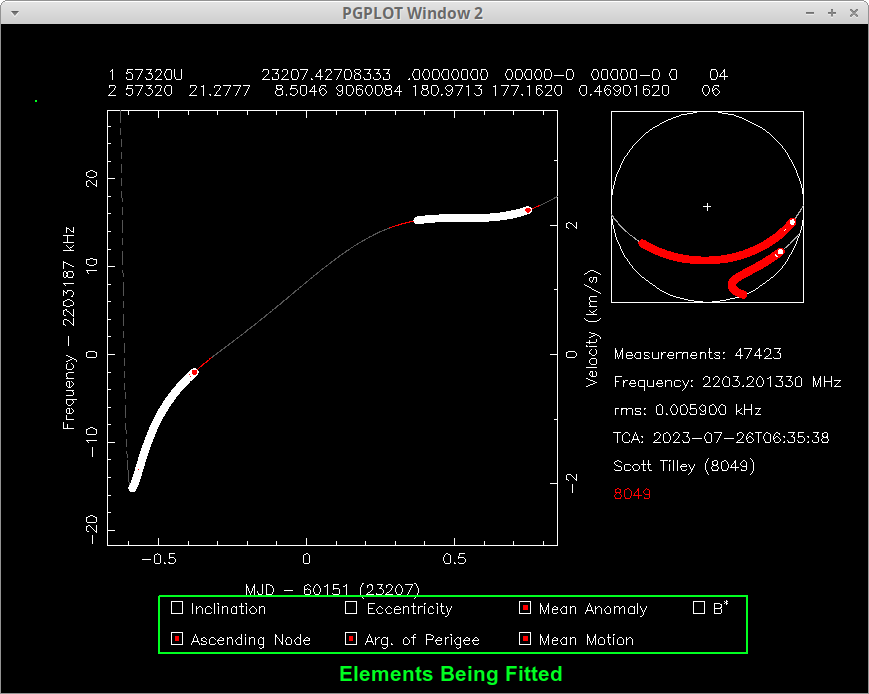
The fitted elements block allows the user to select which elements should be fitted for the best fit to the data. Careful selection of these given understanding of the orbital dynamics allows the user to find the best correct fit to a data set.
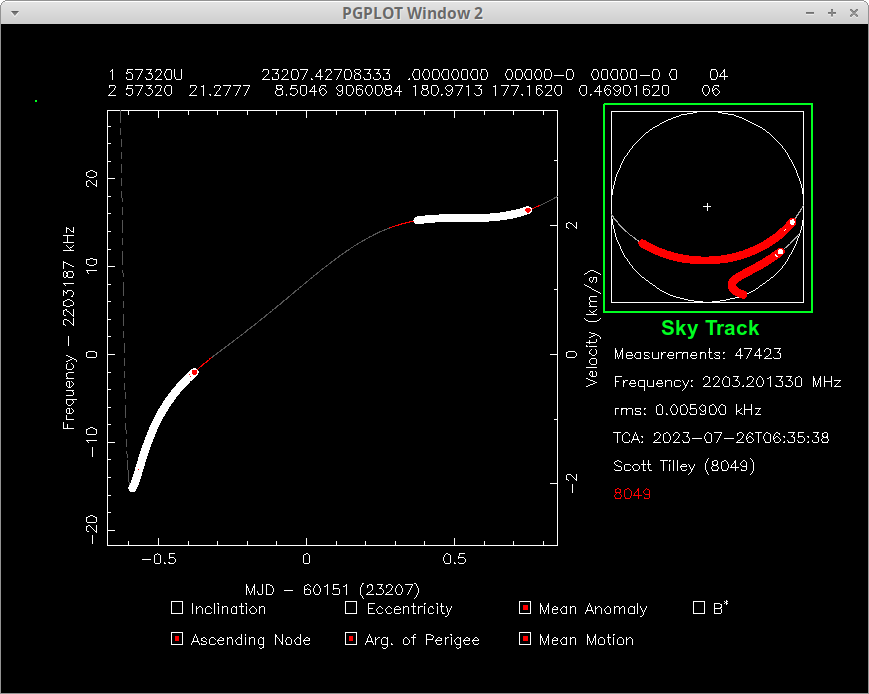
The sky track block allows the user to visualize the satellite’s path through the observer’s sky during times data is present. This is helpful when comparing to other data sources like antenna position etc.
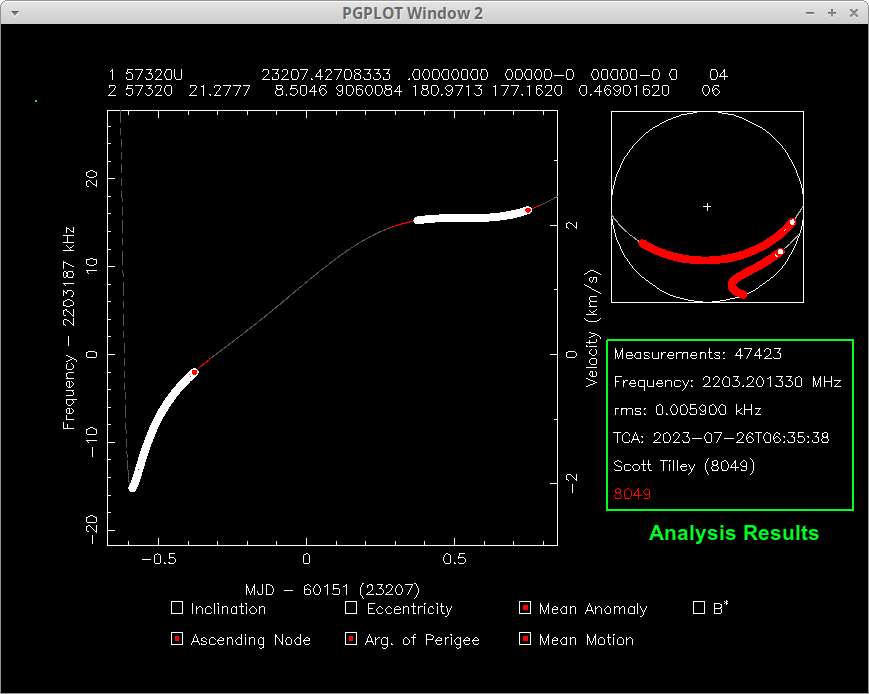
The analysis results block provides the basic summary of the current Doppler analysis. Measurements is the total number of Doppler samples in the analysis. Frequency is the measured spacecraft emitted frequency once Doppler is accounted for. The rms is Root Mean Square error of the data compared to the model. TCA is Time of Closest Approach to the observing station performing the analysis. The name and COSPAR # for the observing station is next. The RED 8049 means that observing station 8049 data is present. If another station also contributed data their number and a different colour would be used to represent that.
To understand how good or bad an analysis is look at the rms number. The lower the better.
How Accurate is Doppler Analysis?
Accurate Doppler analysis relies on the observer recording very accurate frequency samples of the observed satellite signal. Therefore, using a very accurate clock for timing is required. In my case I use a GPS referenced oscillator to perform this function. This leads to the other source of error the spacecraft itself. Most spacecraft in Earth orbit and in Lunar orbit don’t usually have super stable radio oscillators. The reason is they don’t usually need this as the control stations will use other methods of determining the range and range rate to the spacecraft like two-way Doppler that uses a transponder on the spacecraft and therefore eliminates the spacecraft’s oscillator as a source of error. However, in our case we are limited to the one-way Doppler and must deal with the errors. If you want to learn more read NASA JPL’s Range and Doppler Tracking Observables.
